

How to Build an End to End Analytics Platform That Drives Business Growth

An end to end analytics platform is a connected system that collects your data, stores and cleans it, analyzes it, and delivers insights to the people who make decisions, all in one continuous flow. You can build a working version in four to eight weeks if you start with a clear business question, a short list of data sources, and one person accountable for the result. Moderate technical comfort helps, but the first build is more about planning than programming.
Why does this matter for growth? Most businesses already have the raw material. Ad platforms report clicks, a CRM tracks leads, and a point-of-sale system records revenue. The trouble is that each sits in its own silo, so nobody can say which campaign actually produced the customer. A unified platform closes that gap. It lets you trace a dollar of ad spend to a dollar of revenue, then shift budget toward what works while the data is still fresh.
That is the thinking behind how Titane approaches data management and ad servicing across the Americas: measurement and delivery belong together, and innovation only pays off when it’s tied to results you can verify.
This guide covers what you need before you start, the stop conditions that protect your data and budget, the build steps in order, and how to confirm the platform is telling you the truth.
What an End-to-End Analytics Platform Actually Does for Growth

An end-to-end analytics platform is a connected system that follows your data from the moment a customer interacts with you to the moment that insight changes a business decision. Think of it less as a single product and more as a pipeline: every stage feeds the next, so nothing gets lost or contradicted along the way.
Compare that with the typical alternative. Many teams rely on isolated dashboards: one for the ad network, another for social media, a third for website traffic. Each tells a partial story, often in its own definitions and its own numbers. You can see that clicks went up, but not whether those clicks turned into customers or what they cost you in the end. An end-to-end approach joins those views, so spend, engagement, and audience behaviour trace directly to revenue.
The pipeline has five core layers:
– Collection: capturing events from ads, websites, apps, streaming content, and sales systems.
– Storage: placing that data in one central location instead of scattered exports.
– Transformation: cleaning, standardizing, and matching records, such as recognizing the same person across devices.
– Analysis: measuring performance, attribution, and audience patterns against your goals.
– Activation: sending those findings back into targeting, creative, and budget decisions.
The last layer is what separates a growth engine from a reporting chore. Reports describe what already happened. Activation uses it: shifting budget toward the audiences that convert, retiring creative that stalls, and testing new ideas with evidence behind them. Each campaign then produces better data for the next one.
For business owners, the payoff is simple. You stop debating whose numbers are right and start deciding where the next dollar earns the most. That clarity is what makes the platform worth building, and the steps that follow show how.
What You Need Before You Start: Tools, Data Sources, and Team Roles
Before you connect a single data source, gather the building blocks. Skipping this stage is the most common reason analytics projects stall halfway through, because teams discover missing access or unclear ownership only after work has started.
Here is the checklist to confirm first:
- A written list of business goals and the KPIs that measure them, such as acquisition cost, return on ad spend, and lifetime value.
- Admin-level access to every ad network and social media account you run campaigns on.
- Tracking tags and event collection installed on your website and app, with a consistent naming convention.
- CRM or sales records that can be matched to marketing activity.
- A storage layer, typically a cloud data warehouse, plus a visualization or BI tool for reporting.
- One internal owner accountable for the platform from build to maintenance.
- Sign-off from stakeholders in marketing, sales, and finance on how success will be defined.
The people matter as much as the tools. At minimum, you need someone who understands the business questions, someone who can handle data engineering or tagging, and someone who will read the dashboards and act on them. In smaller teams, one person may cover two of these roles, and that is fine as long as nothing is left unowned.
If you operate across several countries, plan for the differences early. Decide which currency you will report in and how exchange rates will be applied to ad spend and revenue. Account for language variations in campaign names, audience labels, and product catalogues so they roll up cleanly. Also confirm the data rules that apply in each region, since consent requirements in Canada, the United States, and Latin America are not identical. Settling these points now keeps your numbers comparable and your build compliant from day one.
Privacy, Data Quality, and Common Pitfalls to Watch Before You Build

Before you collect a single event, settle the rules for how you will handle personal data. Canada’s PIPEDA and Quebec’s Law 25, US state laws such as California’s CCPA, and Brazil’s LGPD all expect clear consent and a defensible purpose for what you track. Where your infrastructure lives matters too, which is why many teams weigh adTech data centers against regional storage rules before they commit to an architecture.
Collect only what you can justify. If no KPI depends on a field, leave it out. Every extra data point adds risk without adding insight.
Data quality deserves the same discipline. Duplicate events inflate conversions, and mislabelled ones send spend toward the wrong channels. Agree on a naming convention, test each tag in a staging environment, and confirm that one purchase produces exactly one event.
Treat platform-reported conversions as a claim, not a fact. Ad networks and social platforms each take credit for the same sale, so totals rarely match your actual revenue. Cross-check them against sales or CRM records before trusting them.
Know your stop conditions. Pause the rollout if any of these is true:
– Consent tracking is unverified, or events fire before a visitor makes a choice.
– Platform conversions and sales records differ by more than a margin you agreed in advance.
– Event counts spike or drop with no matching change in campaigns.
Resolving these issues early costs far less than rebuilding trust in your reporting after the fact.
Step-by-Step: Building Your Analytics Platform From Data Capture to Decisions
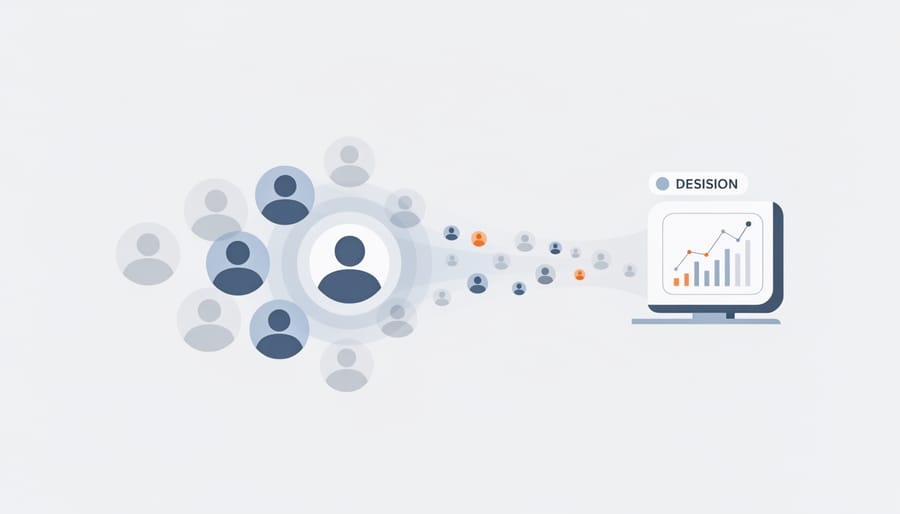
Start With Growth Goals and the Metrics That Prove Them
Before you connect a single data source, decide what growth means for your business. A goal like “grow revenue” is too broad to measure. Translate it into KPIs that show cause and effect: customer acquisition cost, return on ad spend, click engagement, and customer lifetime value. If you want a lower acquisition cost, you now know which spend and conversion data the platform must capture.
Defining metrics first also prevents dashboard sprawl. Teams that skip this step usually end up with dozens of charts nobody trusts and no shared definition of success. Each KPI you commit to becomes a filter: if a data point doesn’t inform one of them, it can wait.
Here is the full path you’ll follow, with each step expanded below:
- Define your growth goals and the KPIs that prove them.
- Map every data source, from ad networks to CRM records.
- Standardize tracking with consistent naming and event tags.
- Centralize all data in a single warehouse.
- Clean and model the data to resolve duplicates and attribution.
- Analyze results and visualize them in stakeholder dashboards.
- Activate insights by feeding them back into campaigns.
Everything that follows depends on step one, so settle your metrics now.
Connect and Standardize Your Data Sources
Most reporting problems start here, not in the dashboard. Before any analysis can happen, pull every source into one place: ad servicing logs, social media platform data, web analytics, streaming engagement, and CRM records. Each of these speaks its own dialect, so the real work is making them agree.
Start with a naming convention and write it down. Pick one format for campaign names, such as market_channel_objective_quarter, and apply it to every ad, audience, and landing page. A campaign called “Spring Promo” in one tool and “spring-promo-CA” in another will split your numbers in two.
Next, standardize your tagging. Use consistent UTM parameters on every link, and define a shared event list for site and app activity, such as view, click, signup, and purchase. Give each event the same name and the same properties everywhere it fires. If you work across several countries, add fields for currency, language, and region from day one.
A shared identifier matters just as much. Understanding what hdata means for your adtech stack shows why consistent, well-structured records make joining sources far easier later.
Finally, test each connection with a small batch before scaling. Confirm that a click in the ad server matches a session in web analytics, then a lead in the CRM.
Centralize, Clean, and Model the Data
Once your sources are connected and labelled consistently, the next job is giving them one home. Load everything into a single data warehouse so ad spend, social engagement, web sessions, and CRM records can sit side by side. When each team keeps its own spreadsheet, the same customer is counted three different ways and nobody trusts the totals.
Cleaning comes next, and it’s unglamorous but essential. Remove duplicate events, standardize currencies and time zones, and flag records with missing campaign tags. A single misfiring tag can double-count conversions and make a weak channel look like a winner.
Then tackle identity. Someone may click a social ad on their phone, browse on a laptop, and buy later through a sales call. Identity resolution links those fragments into one profile using first-party signals like logins, email addresses, and consented device identifiers. Without it, you’re measuring devices rather than people.
With clean, connected profiles, you can build models that answer real questions. Audience models group people by behaviour and value, so you know who is worth reaching again. Attribution models assign credit across touchpoints, showing whether the first ad, the retargeting reminder, or the email sequence is actually moving revenue. Start simple, compare more than one model, and let the gaps between them guide where you test next.
Turn Analysis Into Action Through Dashboards and Audience Activation
Dashboards only earn their keep when someone acts on them, so build each one around a single audience and the decisions that person actually makes. Executives need a one-page view of revenue, customer acquisition cost, and return on ad spend. Channel managers need granular views of placements, creative performance, and audience segments they can adjust daily. Finance wants spend pacing against budget. Give each group only the metrics that drive their choices, and retire any chart nobody opens.
Then close the loop. Feed what the dashboards reveal back into the platform’s activation layer: push high-value audience segments into targeting, retire creative that fatigues, and shift budget toward the channels that show the strongest return. Teams in retail and consumer goods often borrow methods from CPG data analytics where tying demand signals to spending decisions is routine.
This is also where innovation pays off. Real-time optimization lets the platform reallocate budget within hours instead of waiting for a monthly report. Predictive audience signals, such as modelled likelihood to convert or churn, let you reach people before they act rather than after. Treat every campaign as a test, record what you learn, and let each cycle sharpen the next.
How to Verify It Works and Where to Take It Next
Once the platform is live, prove it before you trust it. Start by reconciling reported numbers against two independent sources: the spend and click figures in your ad network accounts, and the revenue in your sales or CRM records. Small gaps are normal because platforms count conversions differently. Large, unexplained gaps mean something upstream is broken.
Next, run a controlled test campaign with a known budget, tagged links, and a clear conversion goal. If the platform credits the right channel and the right amount of revenue, your attribution logic holds. If it doesn’t, fix the tagging or identity matching before scaling anything.
Then check data freshness and completeness. Confirm that yesterday’s data arrives on schedule, that no channel is missing, and that event counts don’t drop off suddenly. Finally, compare outcomes against the baseline KPIs you set at the start, such as customer acquisition cost and return on ad spend. Improvement, or at least clearer visibility into why numbers aren’t improving, is your real test.
With a trusted foundation, growth becomes the next question. Many businesses start by extending proven campaigns into new regions, and well-planned expansion advertising works best when each market has its own baseline metrics, currency handling, and consent rules. After that, consider predictive modelling, such as forecasting churn or scoring high-value audiences, to move from reporting what happened to anticipating what comes next. Lock in a quarterly review cadence to audit data quality, retire unused dashboards, and revisit your KPIs as your goals evolve.

Frequently Asked Questions About End-to-End Analytics Platforms
How long does it take to implement an end-to-end analytics platform?
A focused first version, covering a handful of core channels and KPIs, can often be running within a few weeks. A full build with multiple data sources, identity resolution, and attribution modelling usually takes a few months. Starting small and expanding in phases keeps momentum without sacrificing data quality.
Do small businesses need a full platform?
Not necessarily at the outset. A smaller business can begin with a lean version: clean tracking, one central data store, and a single dashboard tied to revenue. The layers can grow as ad spend and channel count increase.
How is this different from standard web analytics?
Standard web analytics shows what happens on your site. An end-to-end platform connects that behaviour to ad spend, social engagement, and sales records, so you can see which touchpoints actually produce results.
How does first-party data fit in, and can it support campaigns in several countries?
First-party data, such as site activity, purchases, and CRM records, is the most reliable foundation because you collect it directly with consent. For campaigns spanning several countries, you’ll need consistent tagging, currency handling, and regional privacy rules, and approaches to cross-market measurement can help you compare performance fairly.
Maintenance costs vary with data volume, the number of integrations, and how much analysis your team runs in-house. Expect ongoing spend on storage, tooling, and someone who owns data quality, since neglected tracking degrades quickly. Budgeting for a quarterly review keeps the platform accurate and the numbers worth trusting.
End-to-end analytics for business growth turns scattered data into confident, measurable decisions. You start with clear goals and KPIs, connect and standardize your sources, centralize and model the data, then put dashboards and audience insights to work in your campaigns. Verification closes the loop, so the numbers you act on are numbers you trust.
The payoff is a team that spends less time arguing over reports and more time testing, learning, and improving. Innovation follows from that discipline. If you’re ready for your next phase of growth, explore how Titane’s data management, ad servicing, and audience insight capabilities can support the work.
